

November 16, 2026
A company car lease signed today runs into a very different tax position before it ends. The zero-emission BIK appropriate percentage is 4% in 2026 to 2027, but HMRC's published schedule takes it to 9% by 2029 to 2030, with 10% announced for 2030 to 2031. A four-year lease starting in late 2026 touches all five of those rates. For fleet policy owners and drivers choosing from a company car list, the cost over the contract matters more than the rate at signing.
The rates are set out in HMRC's published guidance: Appendix 2 (2025/26 and 2026/27), the 2025 to 2028 rates, the 2028 to 2030 rates and the announced rates for 2030 to 2031 (legislation to follow in Finance Bill 2026-27).
| Tax year | Zero-emission appropriate percentage |
|---|---|
| 2025 to 2026 | 3% |
| 2026 to 2027 | 4% |
| 2027 to 2028 | 5% |
| 2028 to 2029 | 7% |
| 2029 to 2030 | 9% |
| 2030 to 2031 | 10% (announced, legislation in Finance Bill 2026-27) |
The cash equivalent of a company car benefit is the appropriate percentage multiplied by the car's P11D value. As the percentage rises, the taxable benefit rises even when the car's list price stays the same.
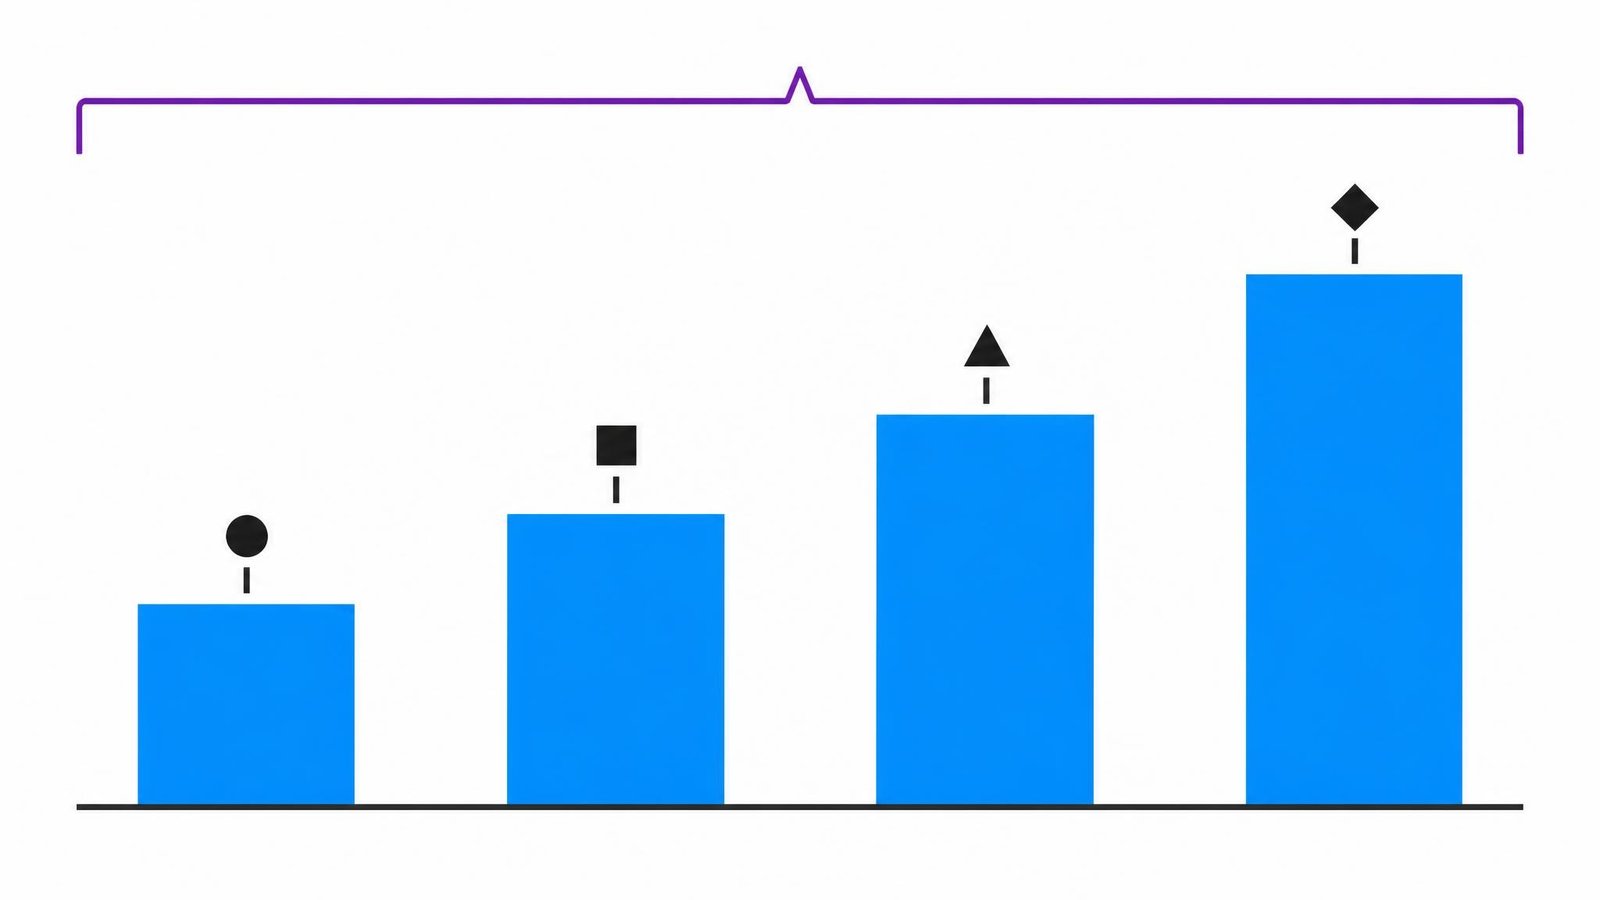
BIK is not only an employee income tax matter. Employers pay Class 1A National Insurance on the same cash equivalent benefit value. HMRC's rates and thresholds guidance confirms the Class 1A rate is 15% for 2026 to 2027. As the appropriate percentage rises year on year, the employer's NI liability rises in step, assuming the Class 1A rate and the P11D value stay the same. For fleets running large numbers of zero-emission company cars, this cost scales with headcount and rate increases combined, and belongs in every EV transition business case alongside the employee's income tax cost.
A standard company car lease runs for three to four years. A four-year lease starting in November 2026 ends in November 2030 and touches five tax years: 2026/27 (4%), 2027/28 (5%), 2028/29 (7%), 2029/30 (9%) and part of 2030/31 (10%, announced). The year-one BIK rate is not a reliable basis for calculating the total cost over the lease, because the appropriate percentage more than doubles between the first and last year of the contract.
Each row below shows the annualised BIK cost at that tax year's rate for a full year. A lease running from November 2026 to November 2030 pays part-years in the first and last tax year, so the actual lease total is less than the sum of the five rows. The figures are indicative; actual costs depend on the individual driver's circumstances.
Assumptions: P11D value of £50,000. Driver pays 40% income tax on the full benefit. Class 1A NI rate stays at 15%. Rates and thresholds can change; figures use the schedule as published at the time of writing.
| Tax year | Rate | Taxable benefit | Employee tax (40%) | Employer NI (15%) |
|---|---|---|---|---|
| 2026/27 | 4% | £2,000 | £800 | £300 |
| 2027/28 | 5% | £2,500 | £1,000 | £375 |
| 2028/29 | 7% | £3,500 | £1,400 | £525 |
| 2029/30 | 9% | £4,500 | £1,800 | £675 |
| 2030/31 (announced) | 10% | £5,000 | £2,000 | £750 |
The driver's income tax on the benefit is not an employer expense, but it directly affects which vehicle a driver chooses from the policy list. For the employer, the fleet-wide BIK cost depends on the number of vehicles, the P11D spread across the choice list and the Class 1A NI rate in each year.
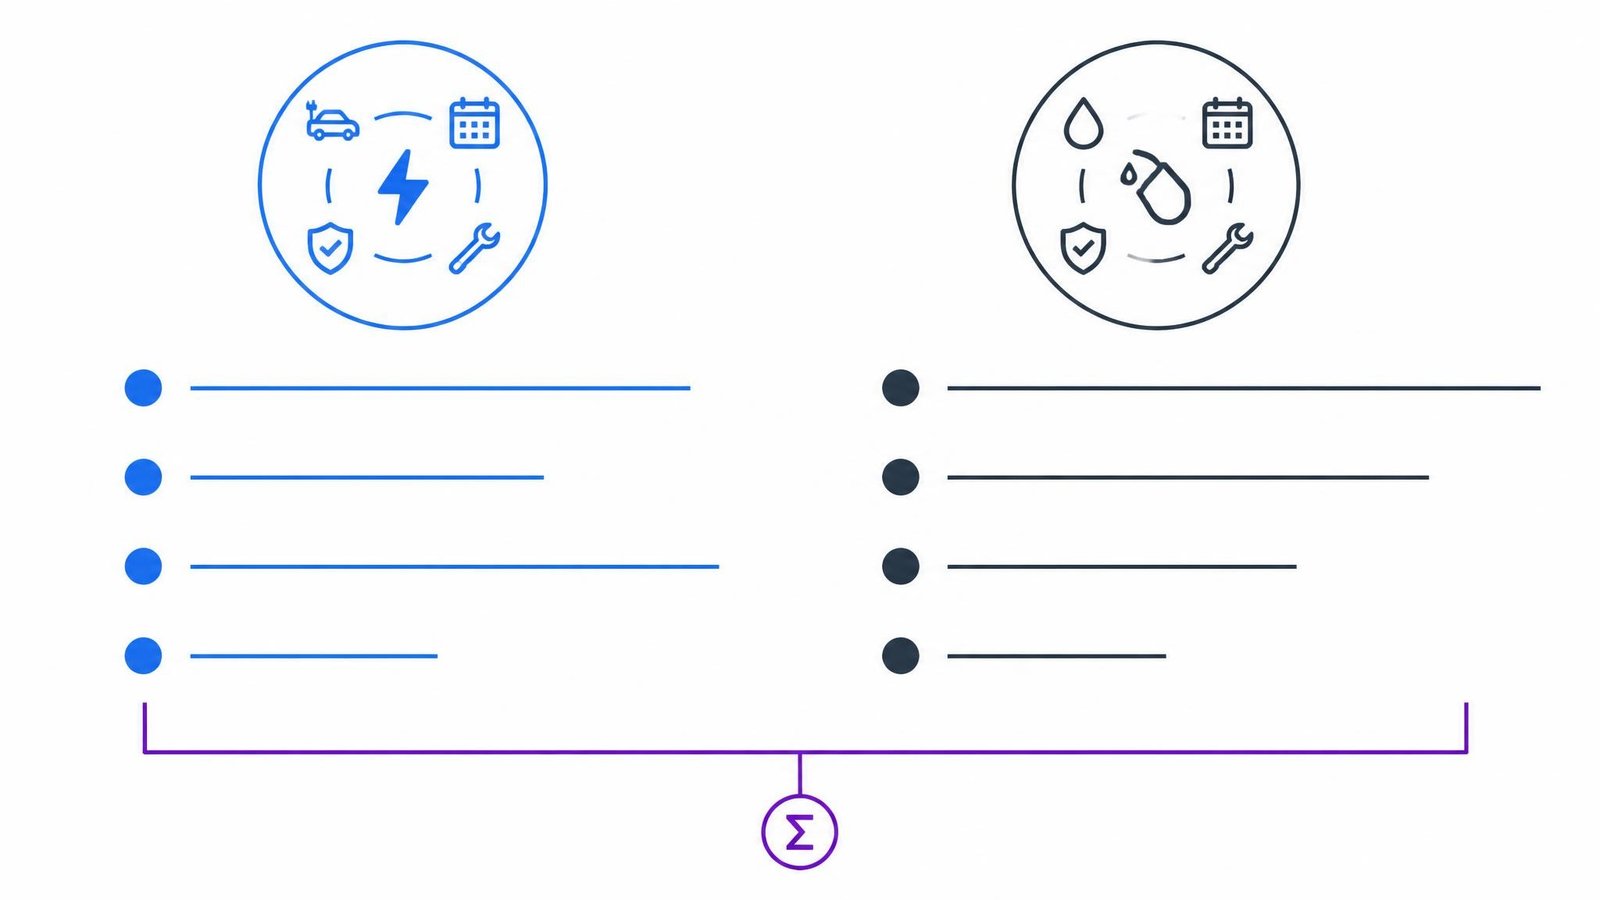
Rising EV BIK rates alone do not show how much the employer cost advantage over a specific petrol or hybrid alternative narrows. That requires a matched comparison across the full lease, covering both BIK-related costs and the operating costs the employer pays directly.
The employer's costs for a company car fall into two groups. BIK-related: Class 1A NI on the cash equivalent benefit value. Operating: lease rentals (typically the largest single line, with residual-value assumptions already priced into the rental), fuel or charging costs, insurance, servicing and maintenance not included in the rental, and charging infrastructure where relevant. On the driver's side, the cost is income tax on the benefit. That tax is not an employer expense, but it shapes which vehicles drivers will accept, and therefore which vehicles the policy needs to offer.
A complete employer cost comparison works out the Class 1A NI for each year of the lease, then adds the operating costs for each option. Employer Class 1A NI = P11D value × BIK percentage × the Class 1A rate, adjusted for the part of the tax year the car is available. P11D value × BIK percentage on its own is the taxable benefit, not the employer's cost. EVs can carry lower running costs on fuel and servicing, and that offset may more than compensate for the rising Class 1A NI charge. An estimate built on incomplete data is still useful as a starting point, provided the missing inputs are stated. The figures that move the result most are the lease rental, P11D value and mileage.
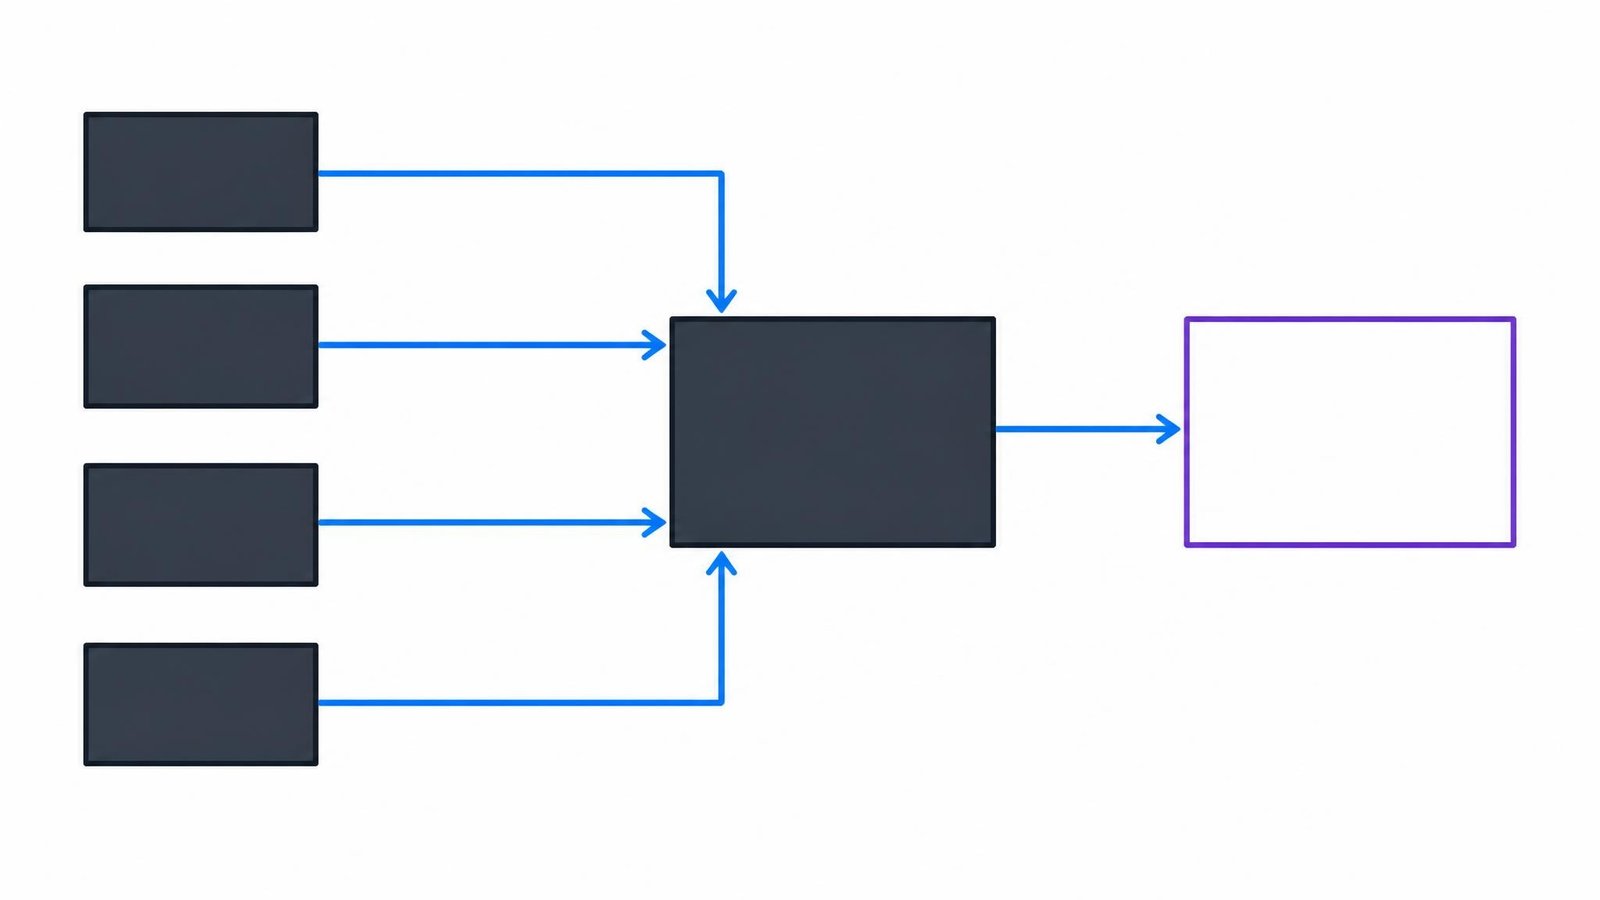
The data for this comparison rarely sits in one place. Vehicle-level utilisation, supplier terms, charging costs and consolidated financial data are typically scattered across spreadsheets, supplier portals and finance systems. This is the data challenge behind fleet sustainability decisions. Organisations subject to greenhouse gas reporting also need to connect the fleet transition to emissions outcomes; the relationship between fleet sustainability and greenhouse gas reporting and the financial case for EVs is one conversation, not two separate workstreams.
The worked example above shows what a single vehicle's BIK trajectory looks like when the inputs are known. Scaling that to an entire fleet, across multiple suppliers, countries and contract terms, is where the data challenge becomes a practical one. The inputs the model needs are the same inputs that underpin every other fleet spend decision: vehicle-level cost, utilisation, contractual terms and consolidated financial data across the fleet. Fleet FinOps is the financial management discipline of identifying, validating, recovering and optimising fleet spend using operational, contractual and financial data.
If the data you hold today is not sufficient to complete a whole-cost EV comparison, the same gap can also limit invoice validation and supplier cost recovery. See how OviDrive connects fleet cost data to transition decisions.
The zero-emission appropriate percentage is 4% in 2026 to 2027 (HMRC Appendix 2), well below the rates for petrol and diesel equivalents. The rate rises to 9% by 2029 to 2030, with 10% announced for 2030 to 2031. The BIK advantage persists but narrows; how much it narrows in practice depends on the alternative vehicle's own rates and running costs.
Yes. Employers pay Class 1A NI on the cash equivalent benefit value, at 15% for 2026 to 2027 (HMRC rates and thresholds). As the appropriate percentage rises, the employer's NI cost rises in step, assuming the Class 1A rate and the P11D value stay the same.
A four-year lease signed in late 2026 touches five tax years: 4% (2026/27), 5% (2027/28), 7% (2028/29), 9% (2029/30) and 10% (announced, 2030/31). Model the full trajectory at signing rather than relying on the year-one rate alone.
Start with the employer's costs: lease rentals, Class 1A NI on each vehicle's BIK, fuel or charging, insurance and maintenance, all modelled across the full lease term. Then show the driver's income tax on the benefit at each year's rate. Residual-value assumptions are generally built into the lease rental, so list them separately only when they are not.
For savvy fleet managers looking for the latest trends and opportunities to improve their fleet's performance.


Copyright © OviDrive Group of Companies • Made with 💜 in Australia 🦘 • Operating in 36 countries and 3 continents 🌎
